
OpenObserve
The Datadog, Splunk and Elasticsearch alternative
From $20 / month · billed monthly
Collect logs, metrics, and traces in one observability workspace. Search events, build dashboards, and keep large volumes of telemetry in a columnar format.
- observability
- logs
- metrics
- traces
- monitoring
- apm
- datadog
- splunk
Screenshots
Frequently asked
- How much does it cost to host OpenObserve?
- Hosting OpenObserve on Zenith is $20 / month, billed monthly until you cancel.
- How long does OpenObserve take to deploy?
- Most apps are live on your own subdomain in about two minutes after you deploy.
- Do I need to manage a server to run OpenObserve?
- No. Zenith runs OpenObserve for you, with no servers to provision or maintain.
- Can I use my own domain with OpenObserve?
- Yes. Each deployment gets a Zenith subdomain, and you can map your own custom domain to it afterwards.
- Can I manage OpenObserve with Claude or another AI agent?
- Yes. Zenith has a Model Context Protocol (MCP) server at https://zenith.hosting/mcp. Add the endpoint from Claude, Cursor or another MCP client, connect your account, and ask the agent to deploy, configure, inspect or delete your OpenObserve deployment. The agent can read and set environment variables. Write-only secrets stay hidden; generated credentials may be returned. Deployment inspection reports live status, HTTPS reachability and summarized resource usage without exposing credentials. A paid deployment requires price approval. Deletion permanently removes the deployment and its data after separate confirmation. Setup is at https://zenith.hosting/connect.
Related apps
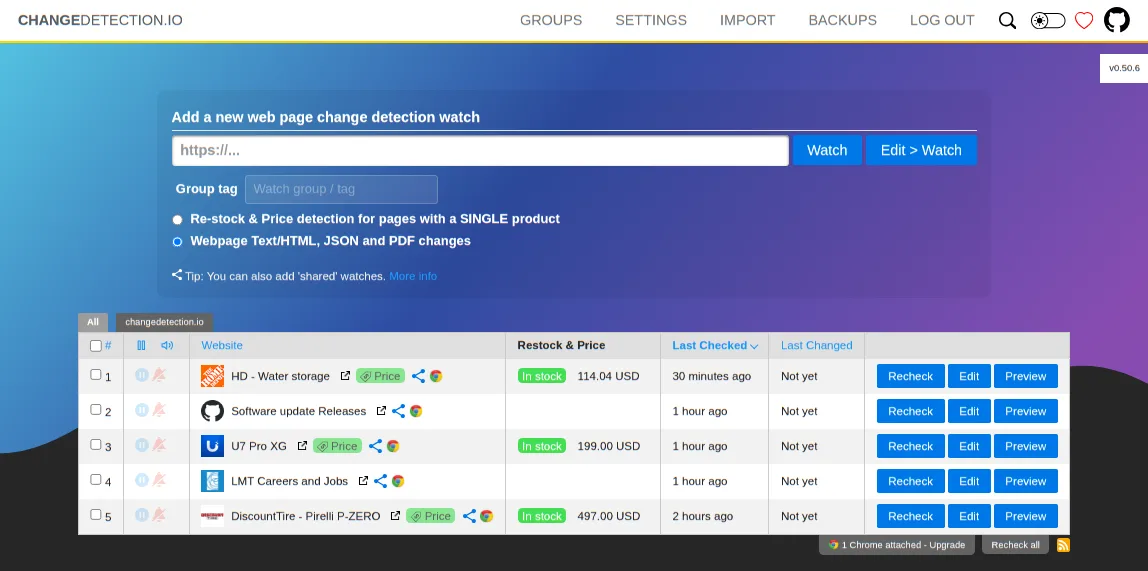
Changedetection.io
Watch pages for changes and get notified when something moves. Track prices, releases, policy updates, and other pages that matter.
- monitoring
- scraping
- alerts
- +2
Gatus
Watch your websites, APIs, and services and publish a live status page. Set response-time and status-code conditions, get alerted the moment a check fails, and show customers exactly what's up.
- monitoring
- status-page
- uptime
- +3
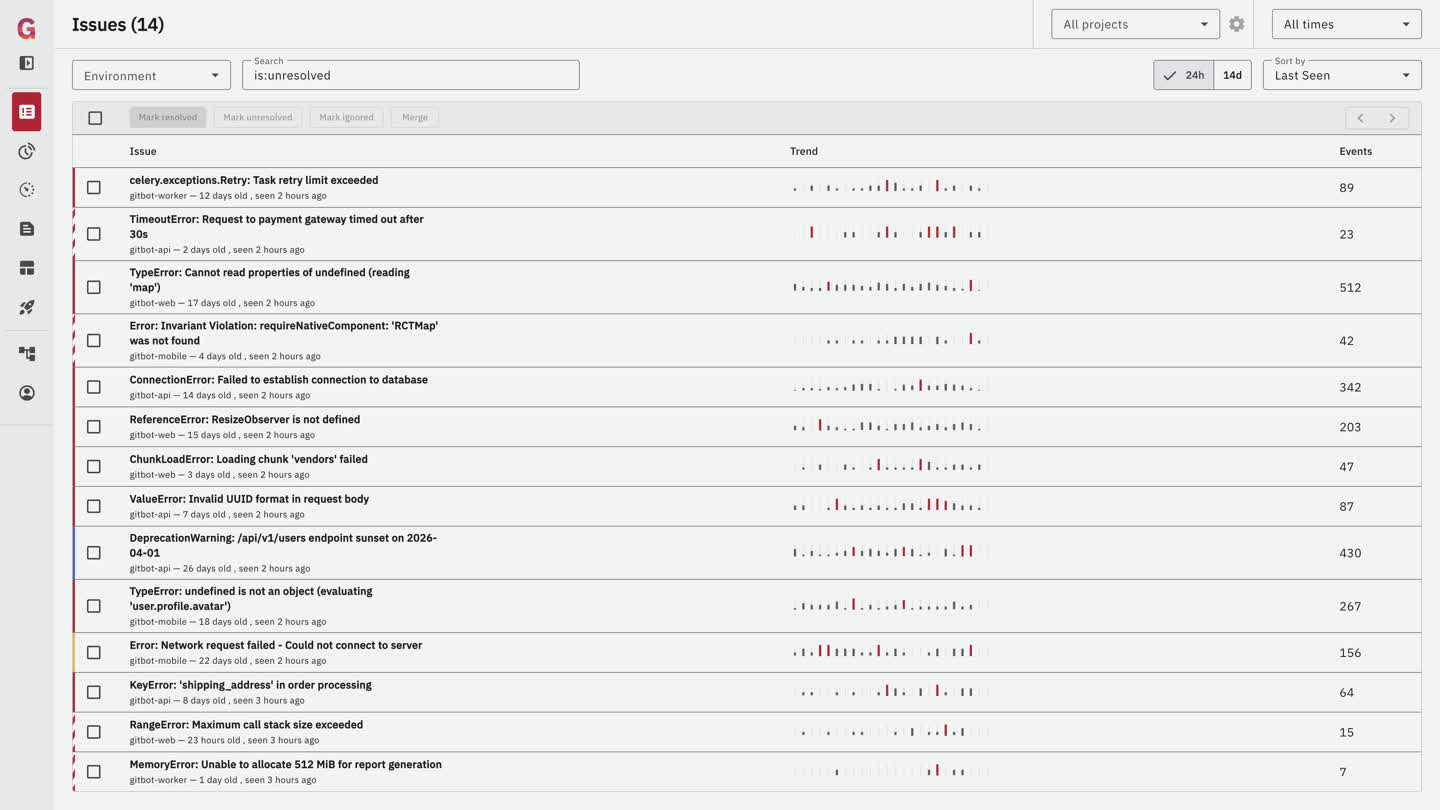
GlitchTip
Catch errors and performance problems before users report them. Use familiar Sentry-compatible event tracking, alerts, and debugging context.
- errors
- monitoring
- sentry
- +4